
Anti Anti Hooking/Debugging - DVIAv2 Part 4
Intro
As we have seen throughout the walkthrough, being able to debug and hook mobile applications can lead to a lot of bypasses. We can also see that this allows us to bypass jailbreak detection. In an effort to make these bypasses more difficult, the application could implement anti-debugging or anti-hooking measures. However we control the device the application is running on, so it is merely a question of reversing skills to find the anti-hooking / anti-debugging measure and disabling it. Hence the Anti-Anti-Debugging and Anti-Anti-Hooking title.
Defeating Anti-Debugging
In the DVIA-v2 application, there is a Anti Anti Hooking/Debugging screen. In this screen there are two buttons. The first will disable debugging, the second will disable injection (hooking).
We can look in Ghidra for the function that runs when the Disable Debugging button is pressed.
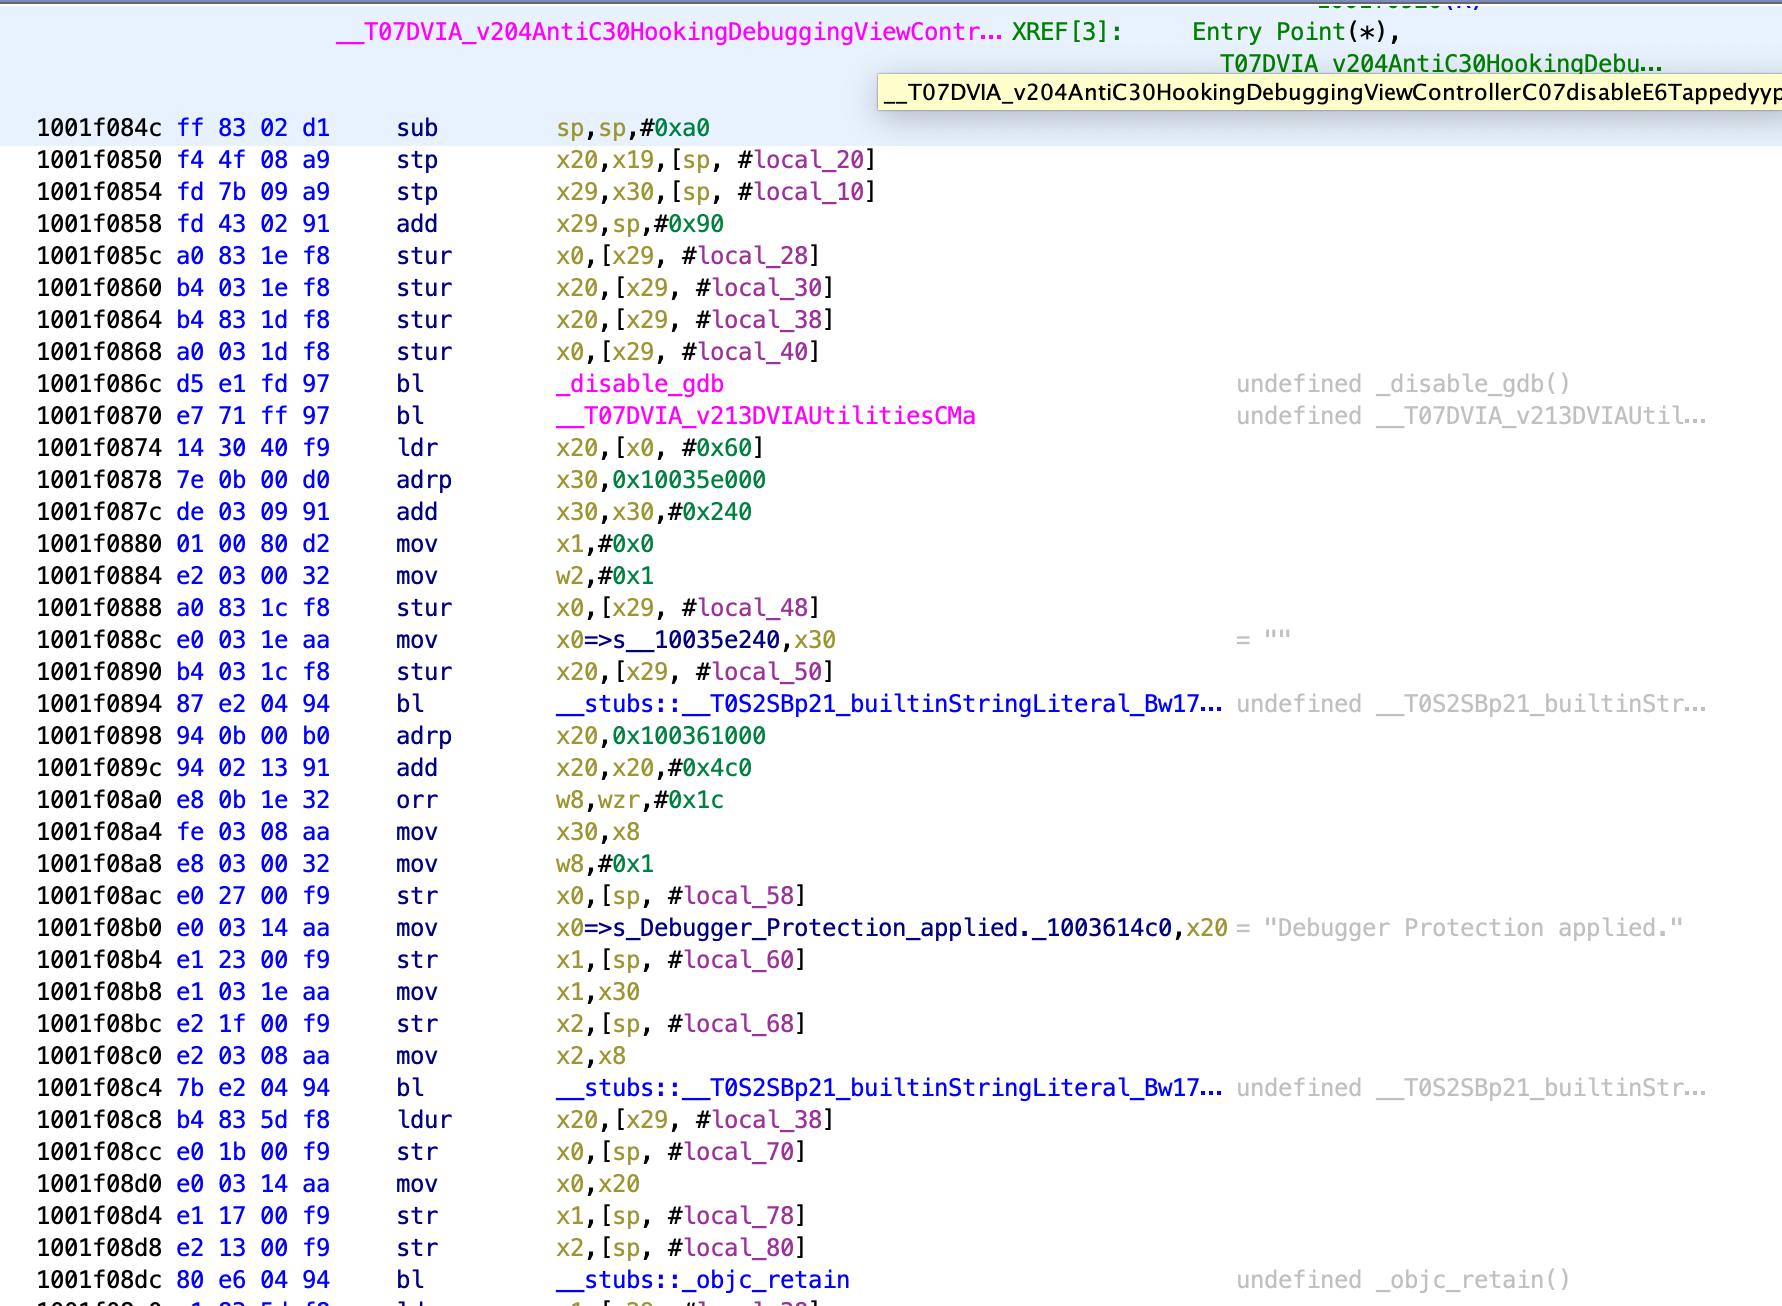
Within this function we see it makes a call to another function.
1001f086c d5 e1 fd 97 bl _disable_gdb
This function is named _disable_gdb and seems like it will be of interest. We can double click on it in Ghidra to go to the function. The whole function can be seen below.
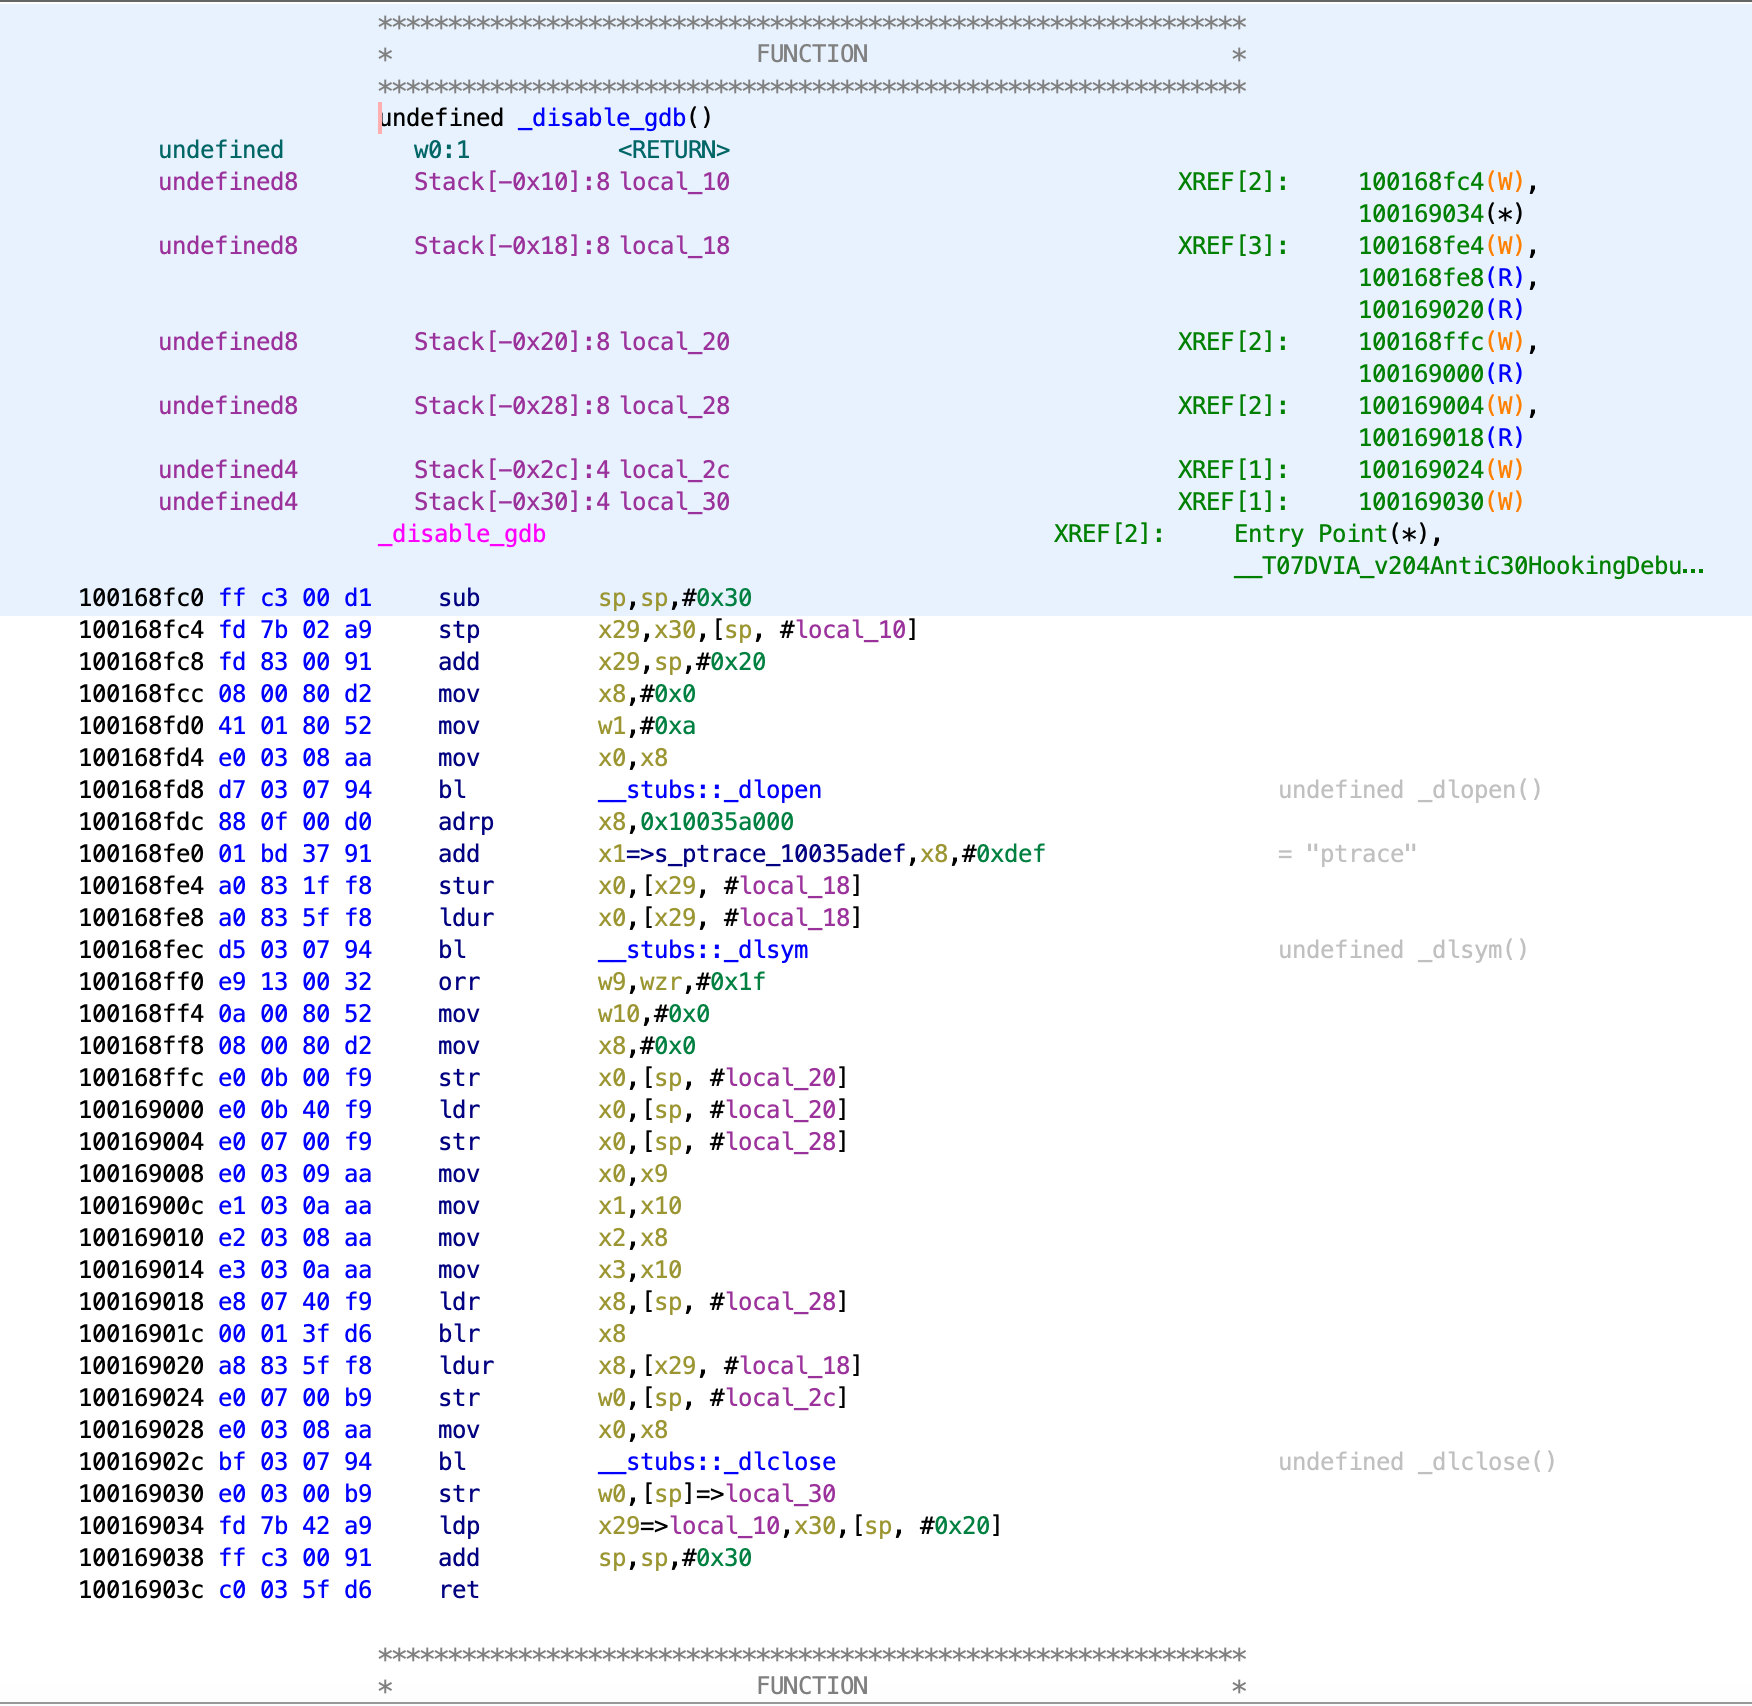
We can see in this function that there is a string for ptrace. If you google about anti-debugging measures on iOS, you will find several documents including OWASP and Apple detailing the use of ptrace to prevent debugging in iOS applications.
Ptrace on iOS has a unique feature, which is the PT_DENY_ATTACH flag, which allows it to be set just to prevent other debuggers attaching. If another one attempts to attach, then the process will terminate.
We can deal with this rather elegantly by setting a breakpoint on ptrace within LLDB. First you will need to launch LLDB and attach ot the application. (SSH in to the iOS device, run the debugserver specifying your mac IP address, run LLDB on your mac, then use process connect connect://IphoneIP:1234 to attach). After you are attached set the breakpoint with:
b ptrace
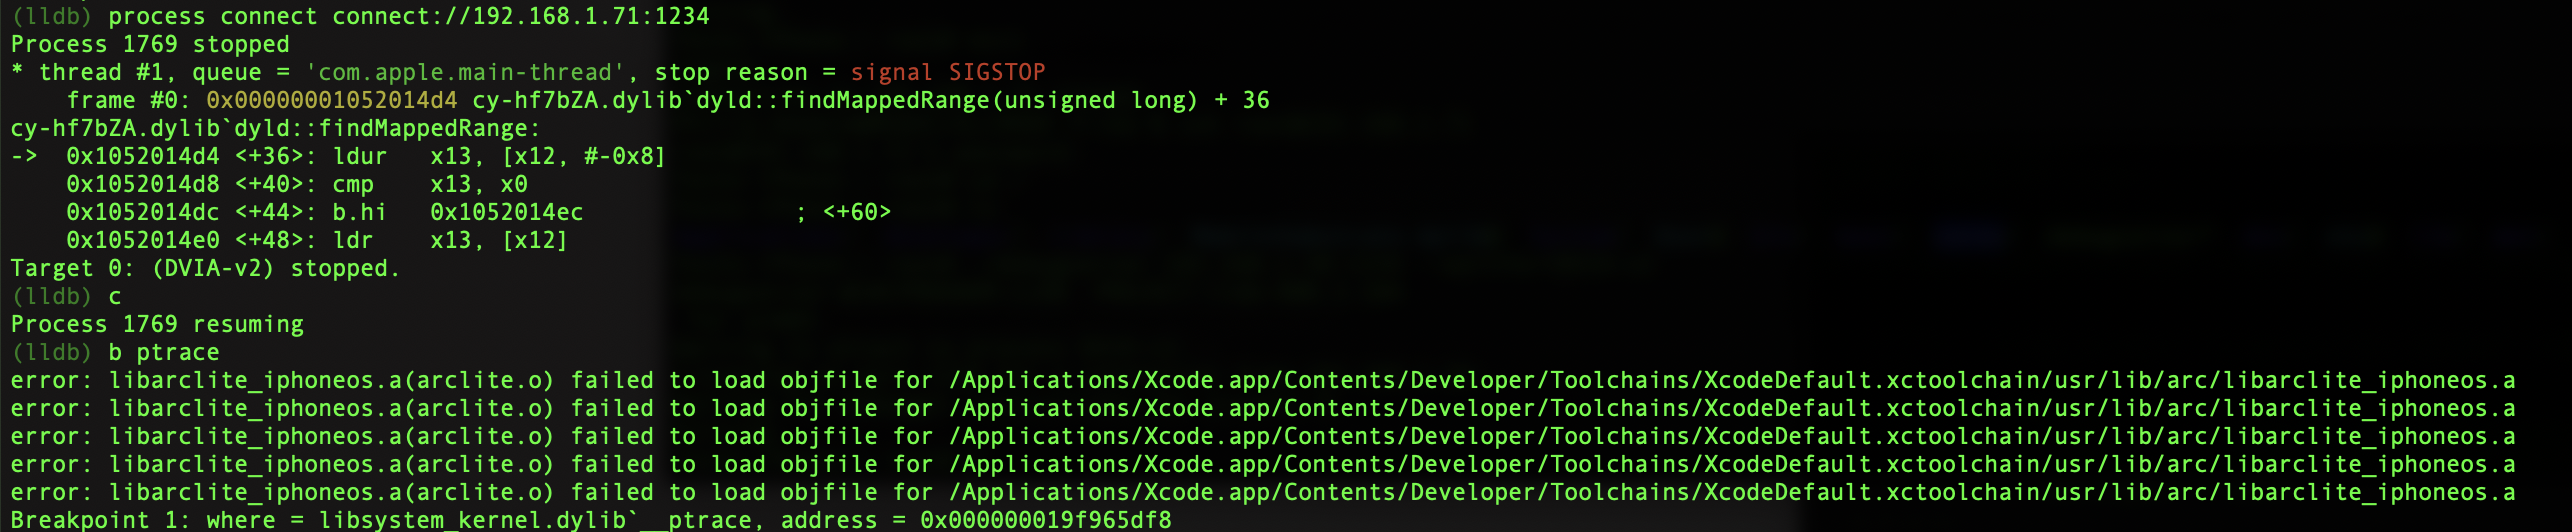
The errors can be ignored as this still worked. Now with the breakpoint set, hit the Disable Debugging button. The application should pause and you will see the breakpoint has been hit.
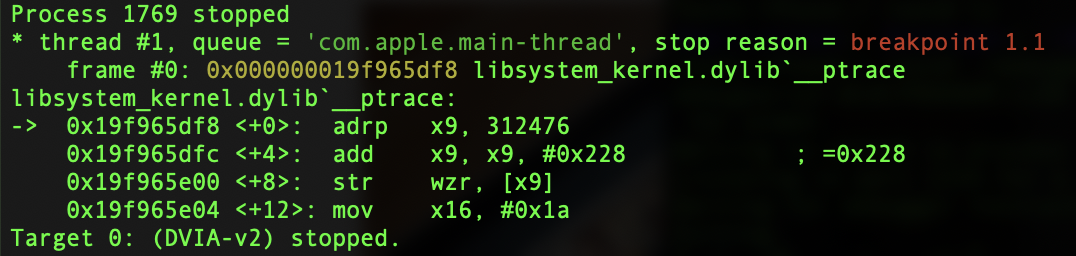
You will also see where it has been paused. Without stepping forward, take a look at the registers.
register read
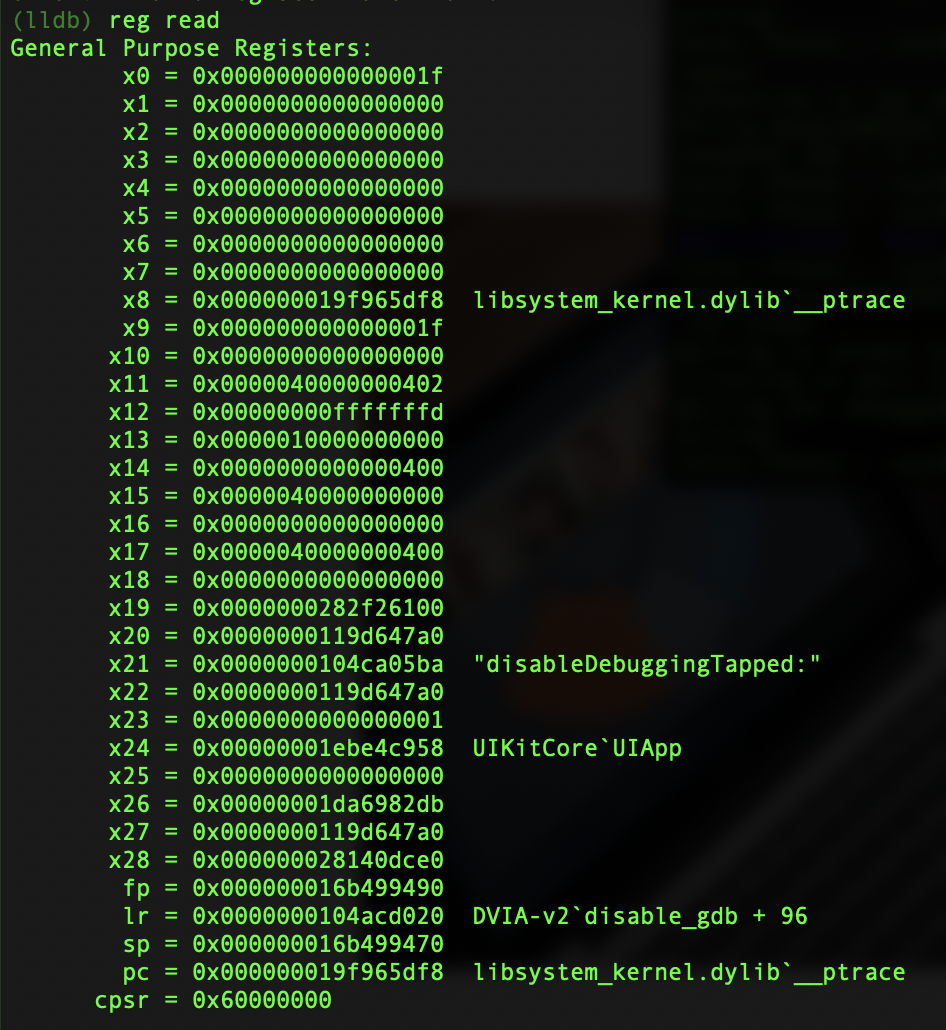
At this point we can see that x0 is currently 0x1f. Without changing anything, continue execution with c. This should lead to the debugger exiting and the process closing with the error message as below.

This shows that the debugging was disabled. Now lets relaunch the application and set the breakpoint on ptrace again. Click the button and then when the breakpoint is hit, this time change the x0 register from 0x1f to 0x0.
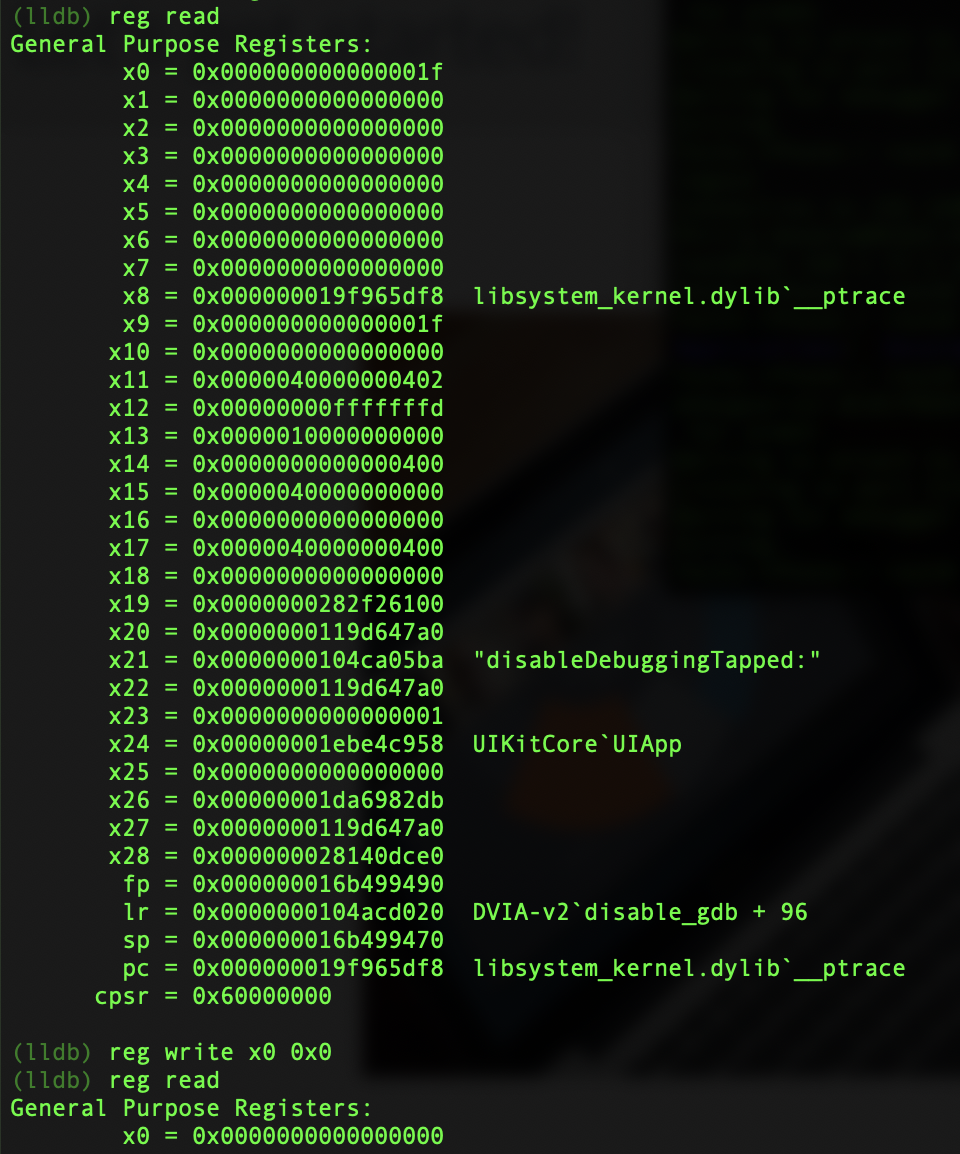
Now continue the execution with c and the popup will show on the application, but there will be no error on the debugger. You can now continue through debugging the application and have bypassed the anti-debugging!
If the anti-debugging measure is more complex, this post may be useful here.
Defeating Anti-Hooking
Anti-hooking measures may be put in place to try stop things like Frida, Cydia Substrate and SSL KillSwitch. I had a bit of an issue with this feature in DVIA-v2 in that it never detected me so I am not entirely sure if my Frida script to disable this works, but I think it could. At some point I will try to get this working so that I can prove that it works / fix it if it does not.
Looking in Ghidra, we see a rather large function for when the Disable Injection button is hit.
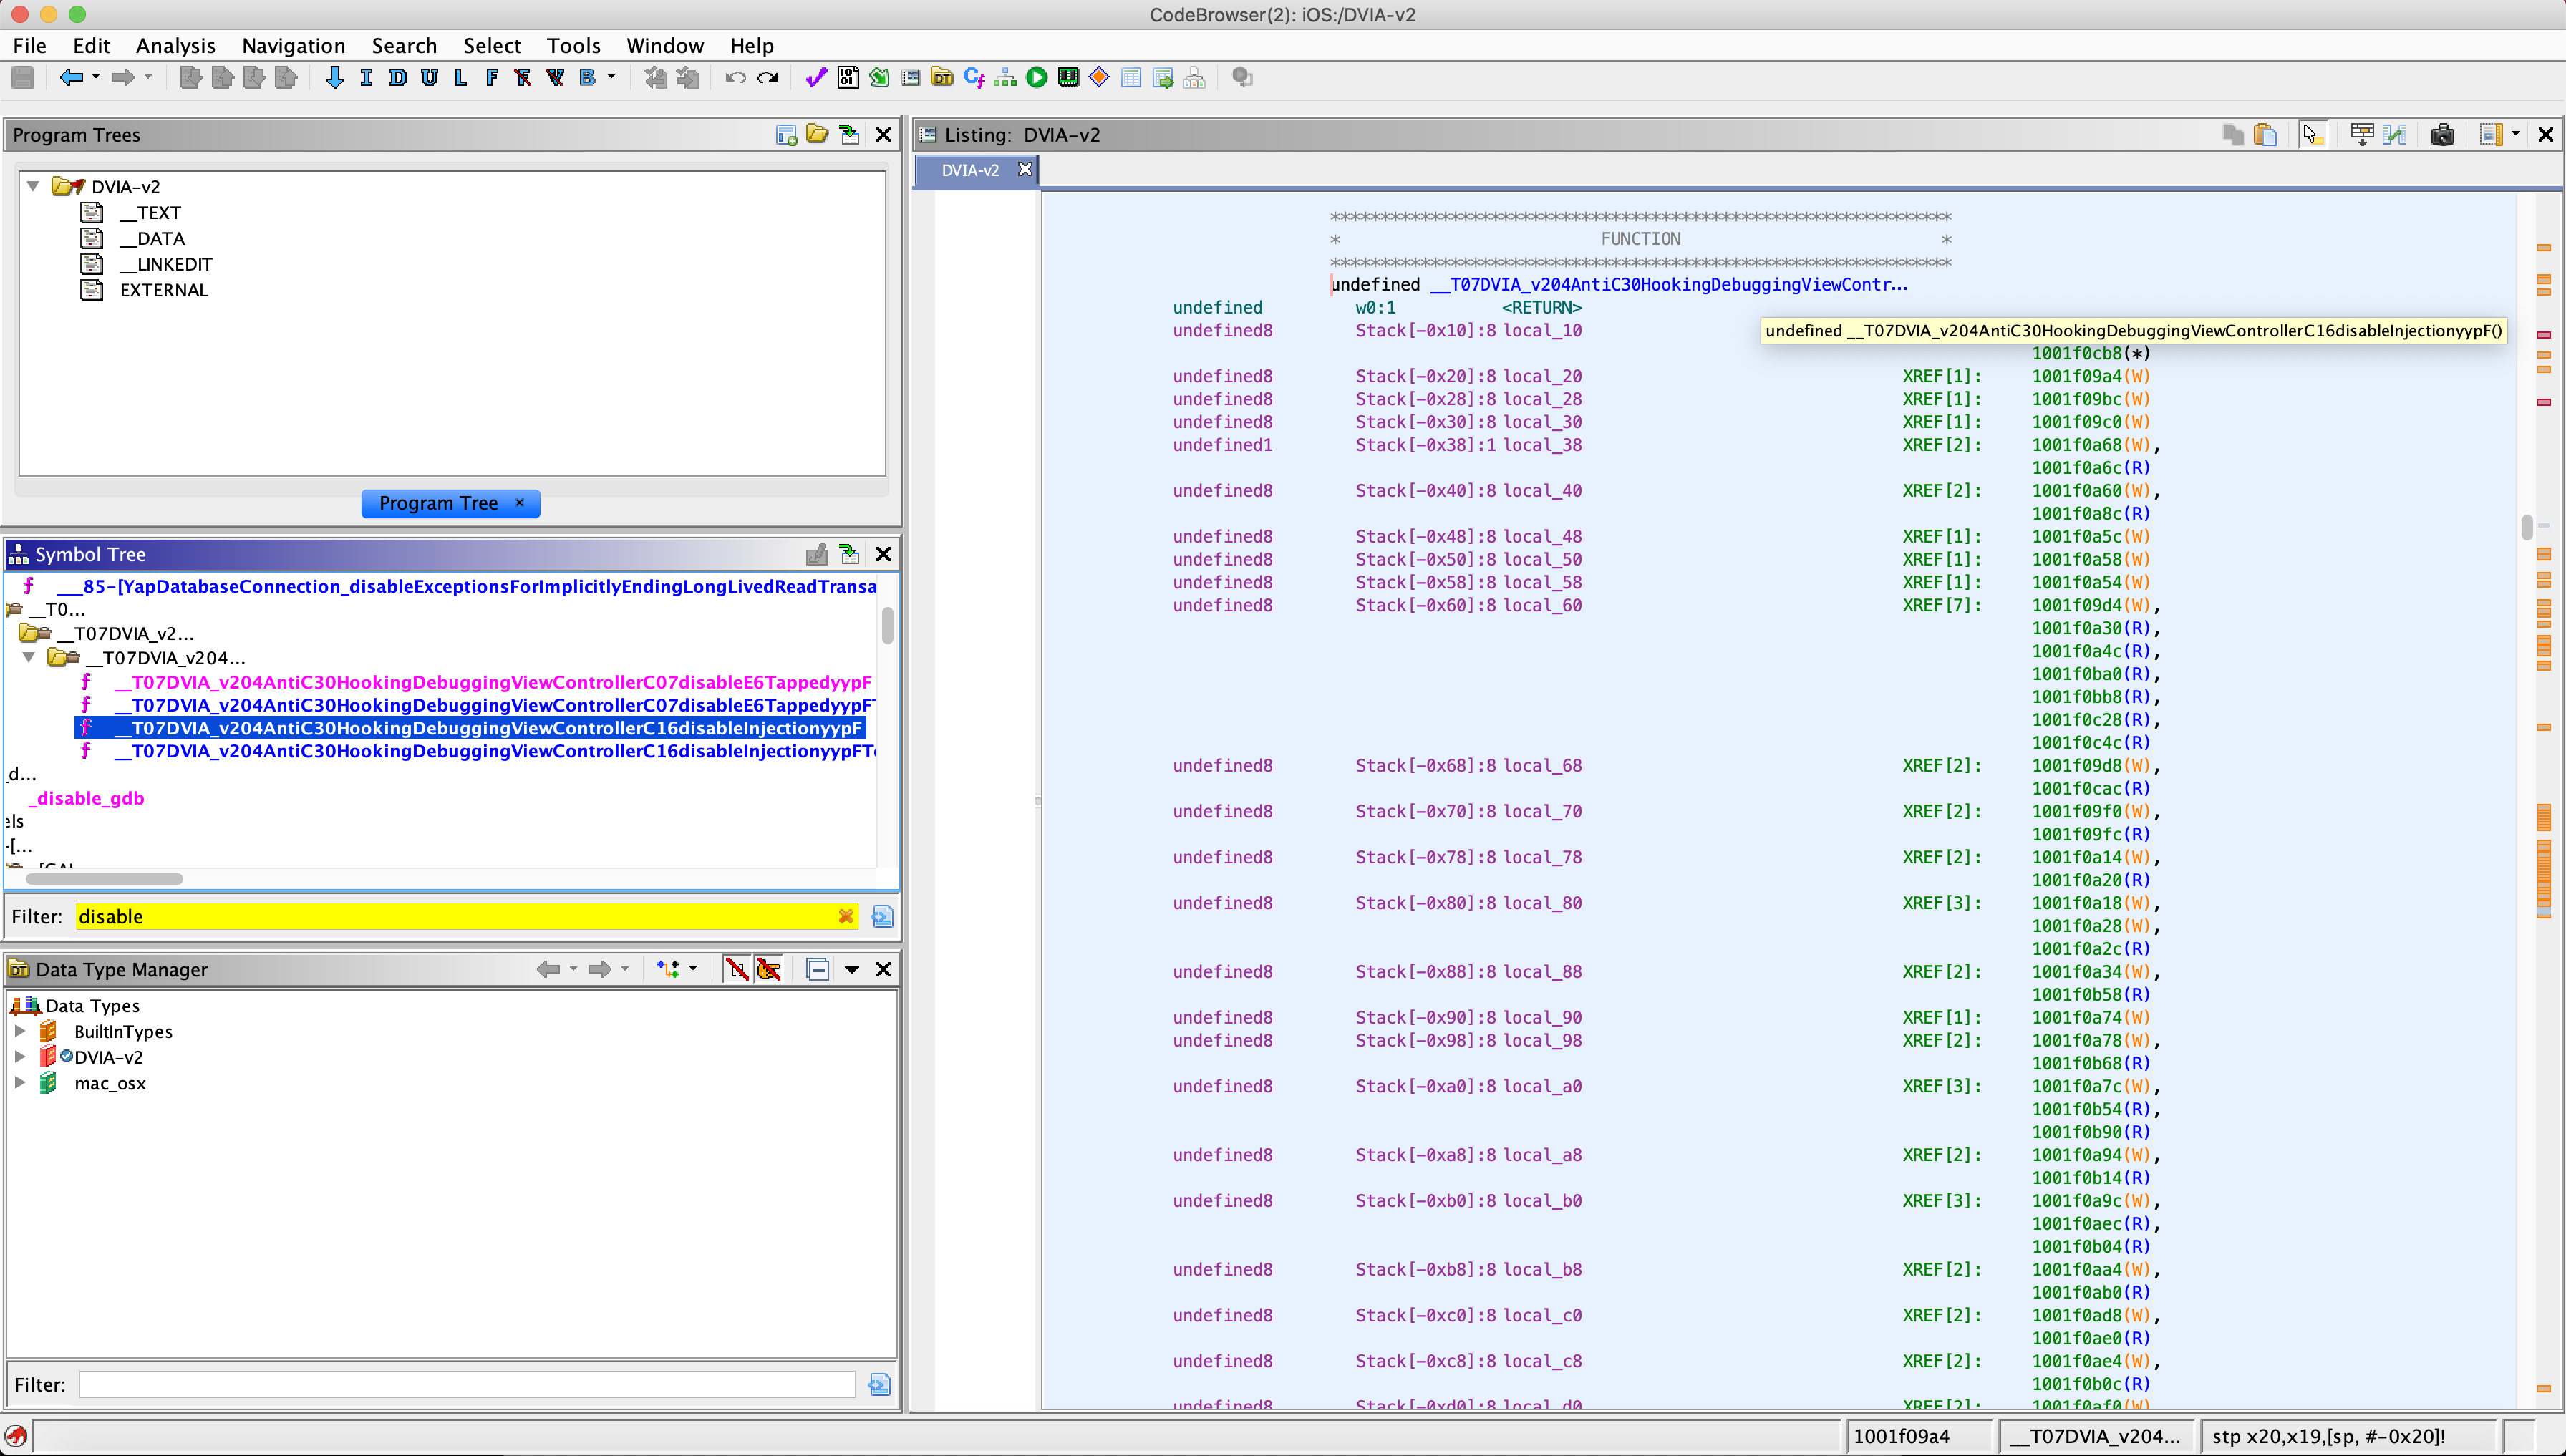
Scrolling through this, we eventually see this.
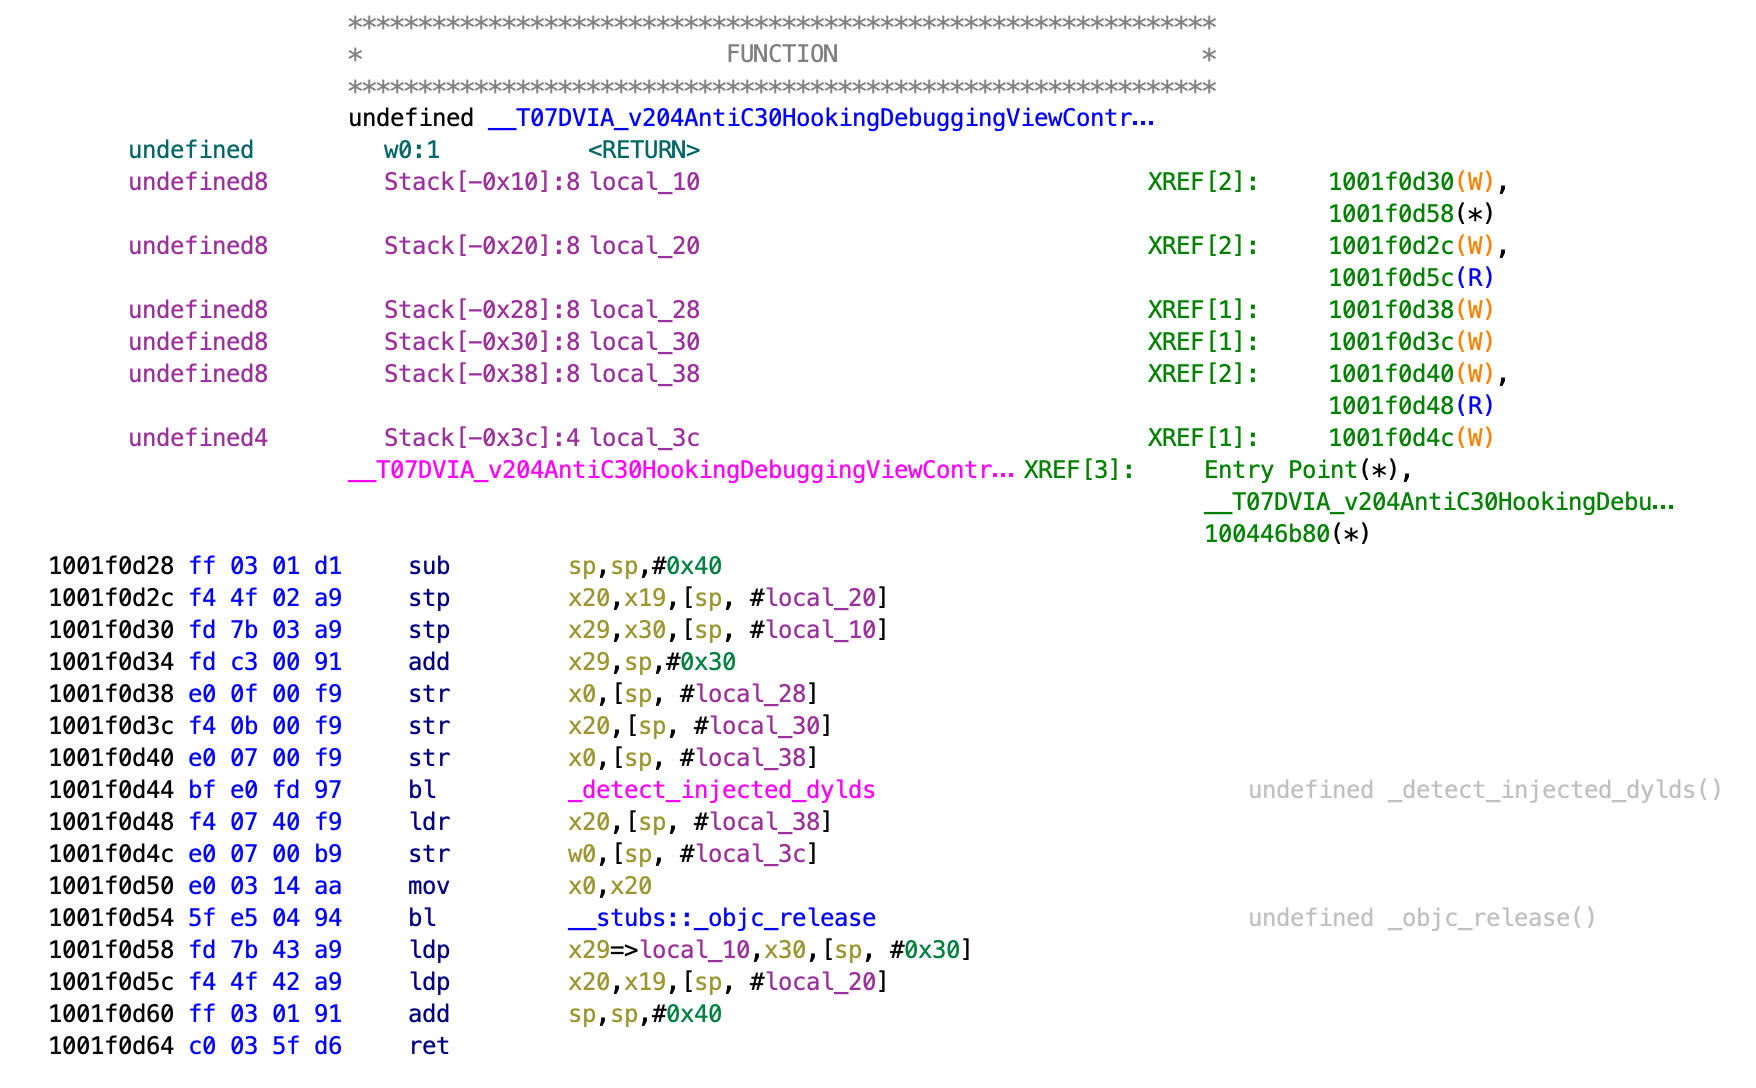
This function is just after the functions for disabling injection and includes the function _detect_injected_dylds. Double clicking on that function shows the contents.
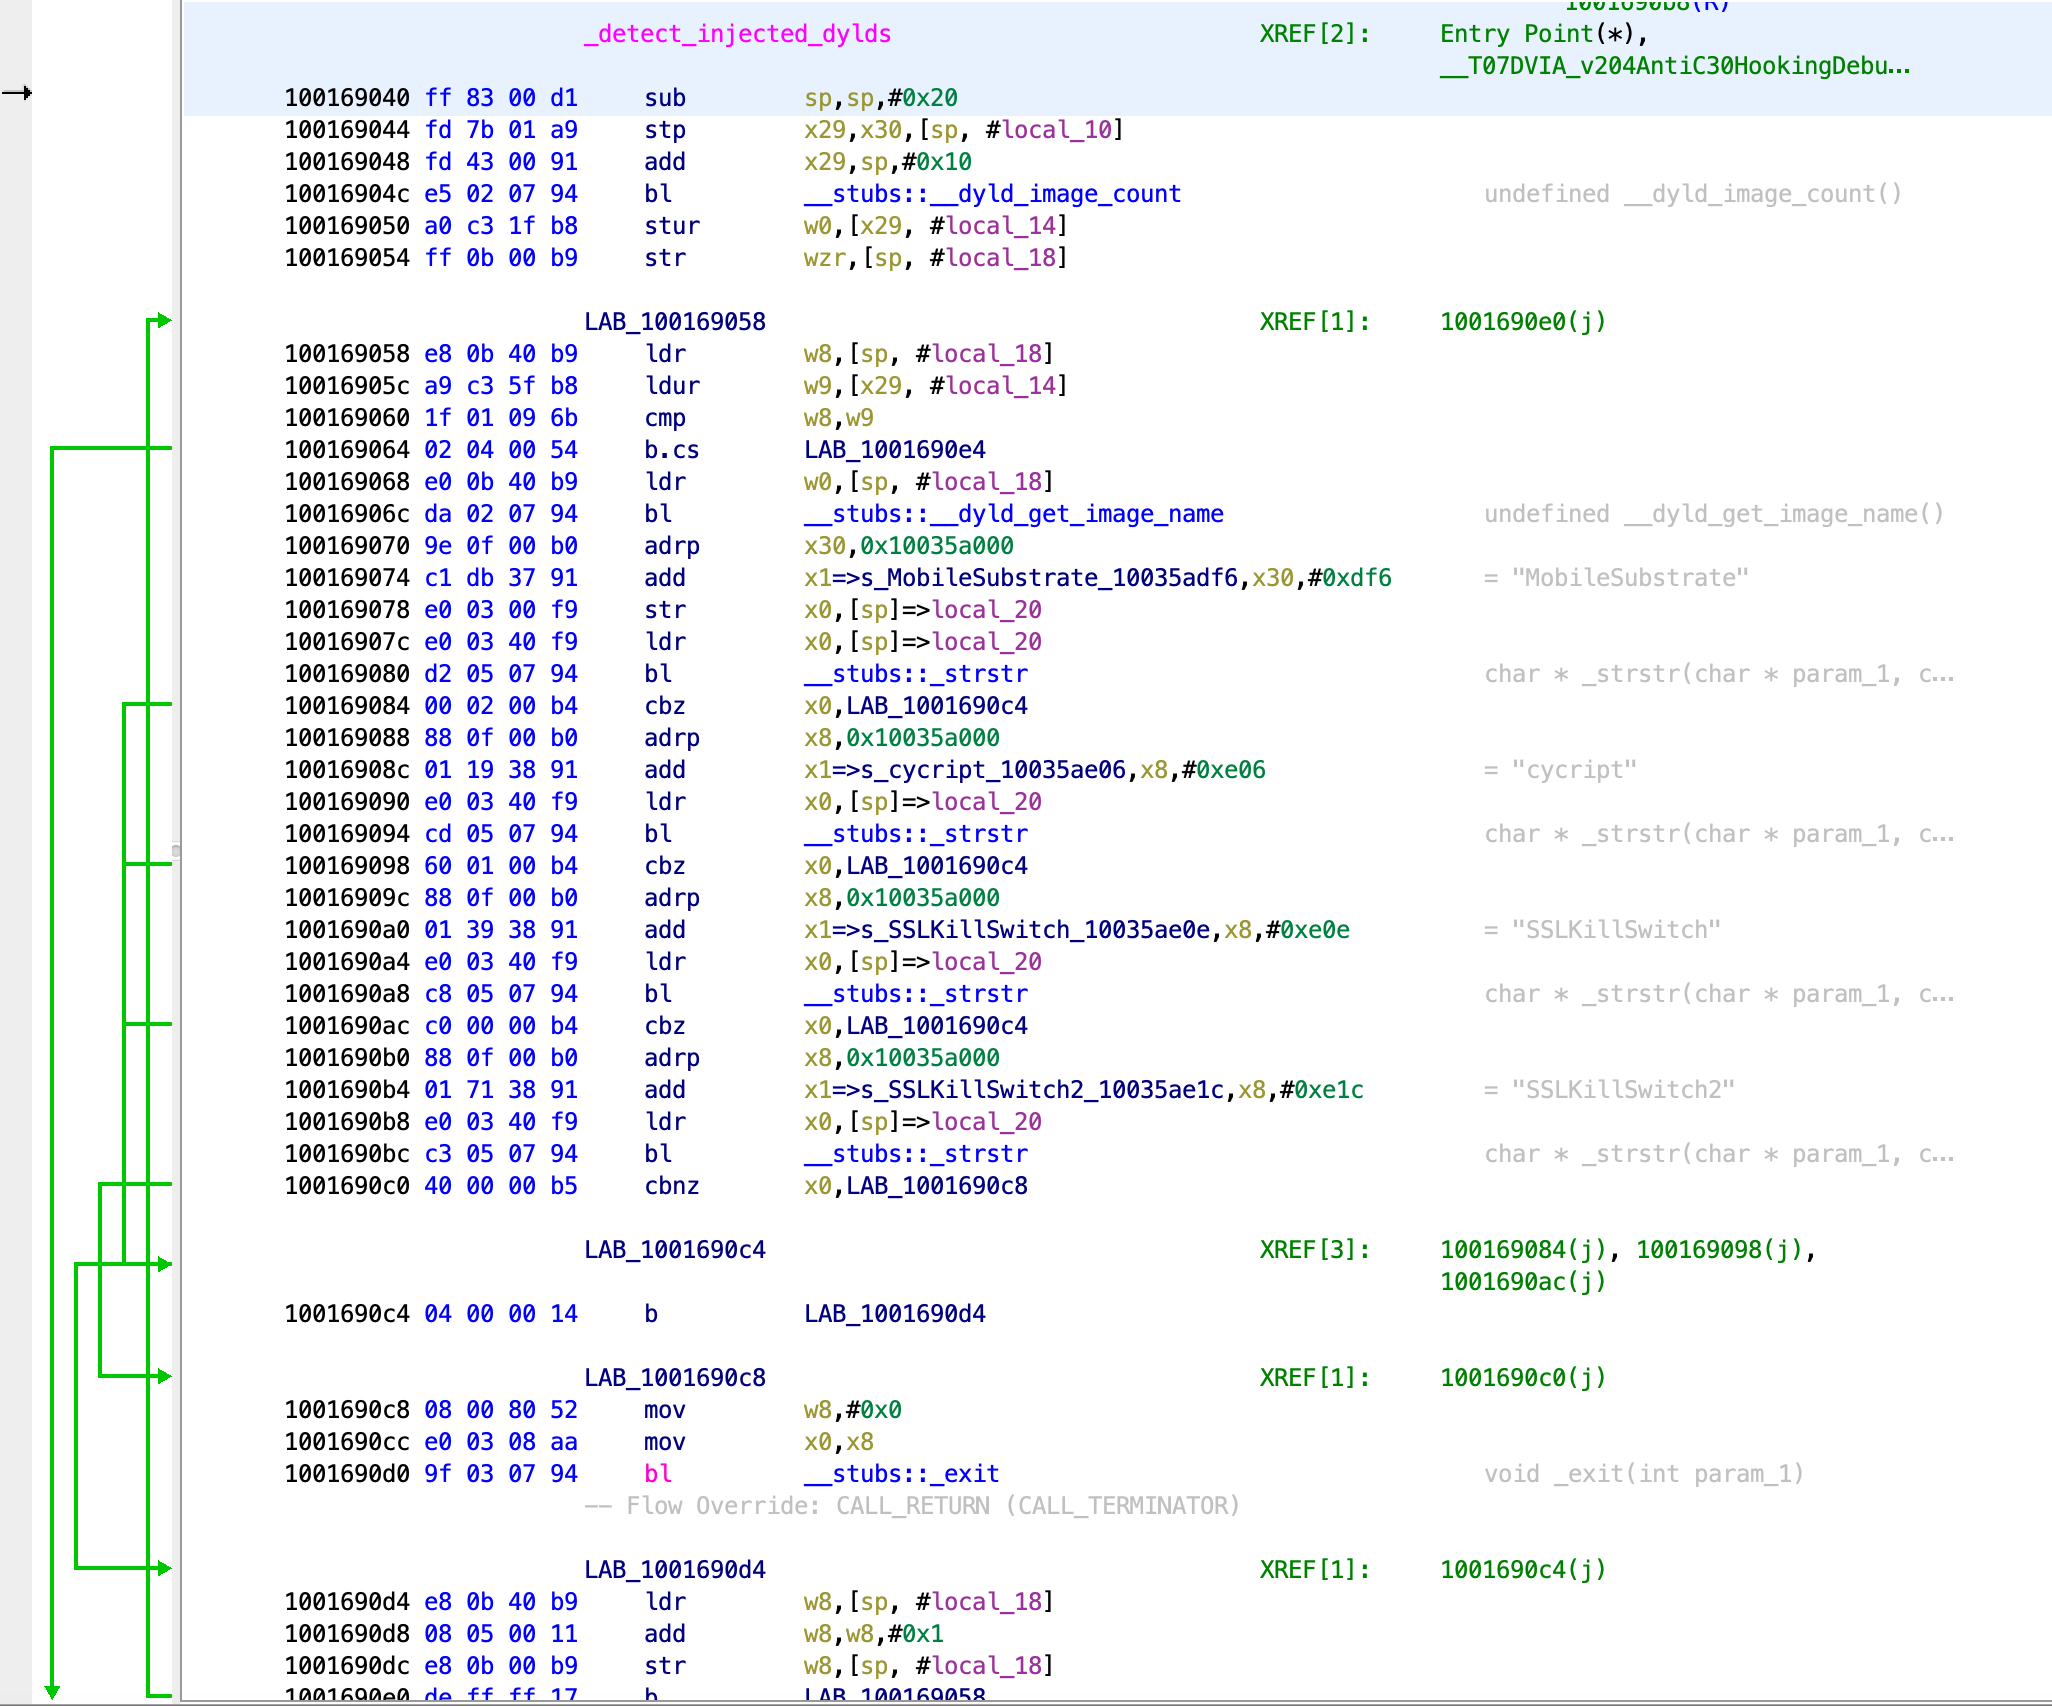
We can see that this function views all the dylds (dynamic libraries loaded within the application process) and gets their name. It then checks for any names such as MobileSubstrate, cycript, SSLKillSwitch, SSLKillSwitch2. If it finds any dylds with these names then it will exit the application.
It seems to check for each of these names, then jumps to the end, then loops back up to the start, then looks for the next one and so on, working in a looping mechanism.
100169058 e8 0b 40 b9     ldr        w8,[sp, #local_18]
10016905c a9 c3 5f b8     ldur       w9,[x29, #local_14]
100169060 1f 01 09 6b     cmp        w8,w9
100169064 02 04 00 54     b.cs       LAB_1001690e4
This part of the assembly is near the top. When the loop happens, it goes to this part of code. The last line is a b.cs instruction and takes a jump that bypasses all of the checks, so I would assume this is how it ends the loop.
Just before that we have a comparison of the x8 and x9 registers. Based on the result of that, the jump will either be taken or not.
I used the following frida script to have a look at the x8 and x9 registers at the location. This prints a huge amount of output since this function continually loops, and then if it detects these at any time it exits. So, you click this button, then try to hook some other function and it should detect.
var targetModule = 'DVIA-v2';
var addr = ptr(0x169060);
var moduleBase = Module.getBaseAddress(targetModule);
var targetAddress = moduleBase.add(addr);
   Interceptor.attach(targetAddress, {
        onEnter: function(args) {
                    console.log('At the address ' + addr + ' the value of x8 and x9 is currently ' + this.context.x8 + this.context.x9);
        },
    });
Running this with Frida (Frida -U -l returnmemvalue.js DVIA-v2) and then hitting the Disable Injection button will print out a lot of values. These wont have a space and will look like:
At the address 0x169060 the value of x8 and x9 is currently 0x1fd0x1a3
Note that there wont be a space between them, that can be easily added in the script. To stop this you will need to use Control + c, exit and then control + c again. During the output, it seemed like x9 was always the same, and then x8 was differing values.
With this, my thoughts are that if I can the jump happen, we can bypass all the checks. Looking online for information about the b.cs instruction lead to this which shows that its a Branch if Carry is Set. This means that the loop will continue to execute until the carry flag is set, then it will end the loop. It also gives the following example.
LDA NumA    Read the value "NumA"
CMP NumB    Compare against "NumB"
BCS Larger  Go to label "Larger" if "NumA" >= "NumB"
...         Execution continues here if "NumA" < "NumB"
This looks very similar to the jump we are looking at. So it seems if we can make the value of x8 equal to or greater than x9, then the b.cs will be taken and the loop will be ended.
With my tests, it seemed that the value of x9 changed in various exeuction cycles, so I made the Frida script below, that should make x8 and x9 always equal.
var targetModule = 'DVIA-v2';
var addr = ptr(0x169060);
var moduleBase = Module.getBaseAddress(targetModule);
var targetAddress = moduleBase.add(addr);
   Interceptor.attach(targetAddress, {
        onEnter: function(args) {
                if(this.context.x8 != this.context.x9){
                    this.context.x8=this.context.x9
                    console.log("Bypass Injection Checks");
            }
        },
    });
Based on documentation, this should work as far as I know. As I can’t actually get DVIA-v2 to detect my hooking, I can not verify this. No matter what I do, after I use the disable injection button, I can always hook and change values with Frida without any issues.
If I get a way to make the detection work, then I will test my script and I will update accordingly if it does not work, so just note that milage may vary.